1 从一个试验说起
1985年,Moehle和 Cavanagh做了一组素混凝土柱与不同配箍形式钢筋混凝土柱的对比试验,试验柱尺寸均为方形柱305 mm× 305mm ,长 914 mm,均采用同一批混凝土和钢筋材料,试验结果见下图所示。
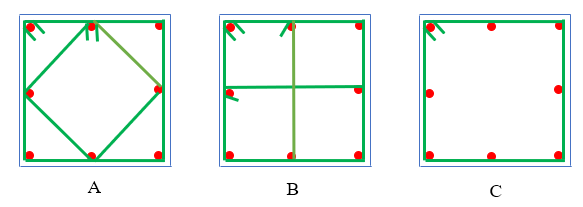
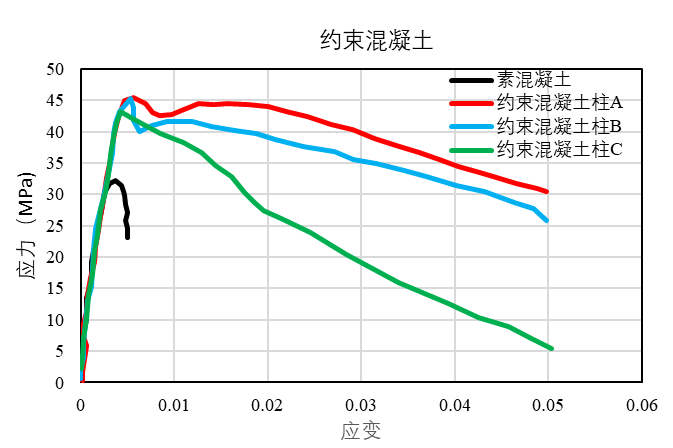
由上图可知,素混凝土试件在纵向压应变达到 0.003时达到峰值强度,然后强度迅速退化,并最终出现斜截面剪坏导致柱失效,这是一种脆性破坏模式。而我们所期望的延性破坏模式是,当纵向应变达到 0.003 时,箍筋出现屈服,而当纵向应变达到0.004时,保护层混凝土剥落,然后强度出现缓慢退化。随着纵向应变的逐渐增加,A柱和B柱在损失了部分强度后又出现了强化,然后再缓慢地退化,而C柱则是直线退化。当B柱环向箍筋屈服,纵筋出现屈曲,部分角部弯钩被拉直,B柱出现失效。
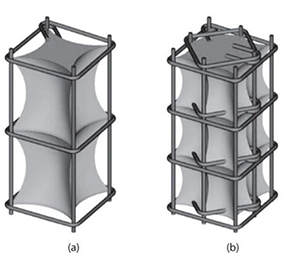
对比素混凝土柱,箍筋对核心区混凝土起到了很好的约束作用,其增强了核心区混凝土的变形能力。仅配置有外圈箍筋的C柱,其变形能力得到了改善,但不如A柱和B柱,配有交叉或重叠的箍筋可以增强约束混凝土的强度。
除了钢筋混凝土柱之外,剪力墙的边缘构件或端柱也是配置有闭合的箍筋,而组合结构构件及钢管混凝土作用,型钢对其所包裹的混凝土也是有较大的约束作用,当然这里主要说的常规钢筋混凝土构件。说起剪力墙边缘构件的重要性,得说说2010年的智利剪力墙结构震害。智利使用的地震设计方法与我们相似,都是采用的反应谱法。针对1985年3月3日发生在南美洲和纳斯卡板块交界俯冲带的7.8级地震,1996年智利的设计谱进行了修订。钢筋混凝土剪力墙建筑的设计要求也进行了更新,参考了ACI318-95,但也有个规定例外的,就是墙边缘构件的约束混凝土及约束钢筋屈曲的加密箍筋被取消。
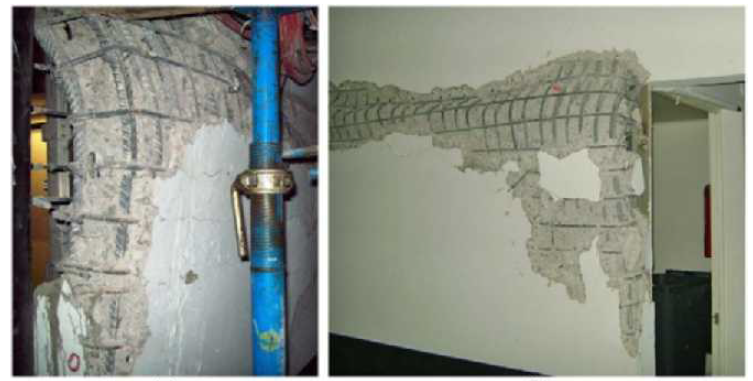
2010年智利地震中,钢筋混凝土剪力墙建筑(墙率大概为3%左右,一字型、L型墙或T型墙组合形成)主要损坏主要出现在地面或接近地面的部位,可以看到混凝土的破碎和剥落以及竖向钢筋的屈曲。像这种贯穿整个剪力墙或者集中在1~3倍墙厚的高度的损伤,显然是因为垂直钢筋屈曲导致的。
震害中发现墙体边缘构件的箍筋间距偏大,边缘箍筋和水平分布筋间距均为200mm。由于这些剪力墙均较薄,为150mm~200mm厚度,而保护层20mm,剥落则会导致墙体的有效厚度减小10%-27%。而一旦保护层剥落,则剪力墙边缘构件的直钩箍筋被拉直后失去约束作用,这样竖向钢筋失去约束后就会发生屈曲。
当然有些也是由于轴向压力较大导致墙体出现整体屈曲,如下图所示,也就是墙体的整体失稳。这种失稳,加强箍筋配置不能解决问题,最好是加厚墙体。这种与上面的情况有所不同。
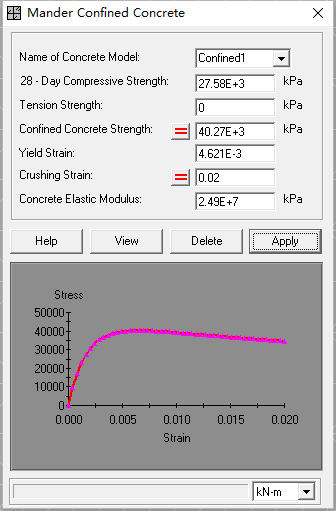
看来箍筋的约束效应很重要,那么非线性计算时,如何考虑约束混凝土本构显得尤为重要,而其中以Mander约束混凝土本构最为流行。
2 Mander本构
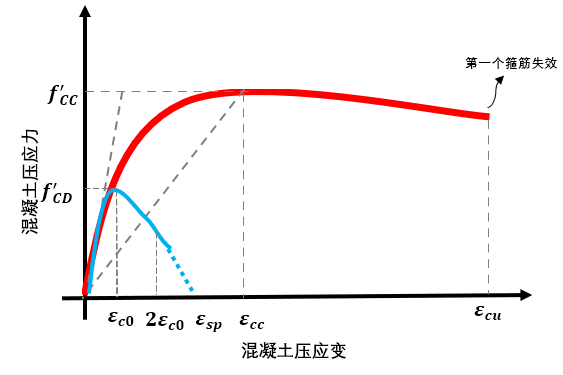
说到这,还真不知道Mander本构是如何流行起来的,但大概是因为他的论文被大量学者引用,而工程中常用的截面分析软件XTRACT内置的约束材料本构也是默认采用Mander本构。一位菲律宾的朋友也说,他更倾向于使用Mander本构进行非线性分析。Mander那篇非常有名的论文详细介绍了Mander本构曲线,见下图。
 (1)
(1)
式中, 是约束混凝土峰值强度,是Mander本构模型的关键。
 (2)
(2)
 (3)
(3)
式中, 是峰值强度对应的混凝土压应变。
![\varepsilon_{c c}=\varepsilon_{c o}\left[1+5\left(\frac{f_{c c}^{\prime}}{f_{c o}^{\prime}}-1\right)\right]](http://www.structurevspoem.com/wp-content/ql-cache/quicklatex.com-289f5bf76dc4e284d941c91a6c583fdb_l3.png "Rendered by QuickLaTeX.com") (4)
(4)
式中, 和
和 分别是非约束混凝土的峰值强度和其对应压应变,一般取0.002。
 (5)
(5)
其中, 。
。
 (6)
(6)
Mander本构引入了有效约束应力和有效约束系数这两个概念。注意此处的强度均指美规的混凝土圆柱体强度。对于矩形截面需要查表确定有效约束系数。

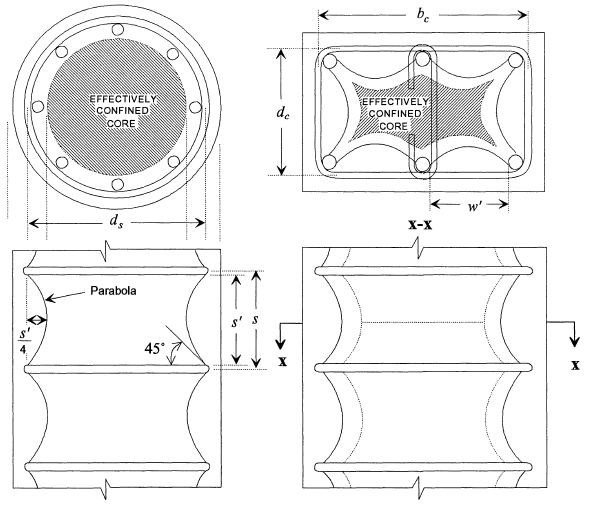
G.A. Chang 改进了Mander本构,使得Mander本构的有效约束系数 可以由公式求得。箍筋的约束作用并不是均匀施加到核心区混凝土上的,而是产生了拱效应,使得核心区外围部分压应力较小,而中间区域较大。
对于圆形截面按下面公式可以求得:


核心区混凝土面积
式中, 为有效侧向约束应力。

式中,体积配筋率 ,纵筋体积配筋率
 。
。
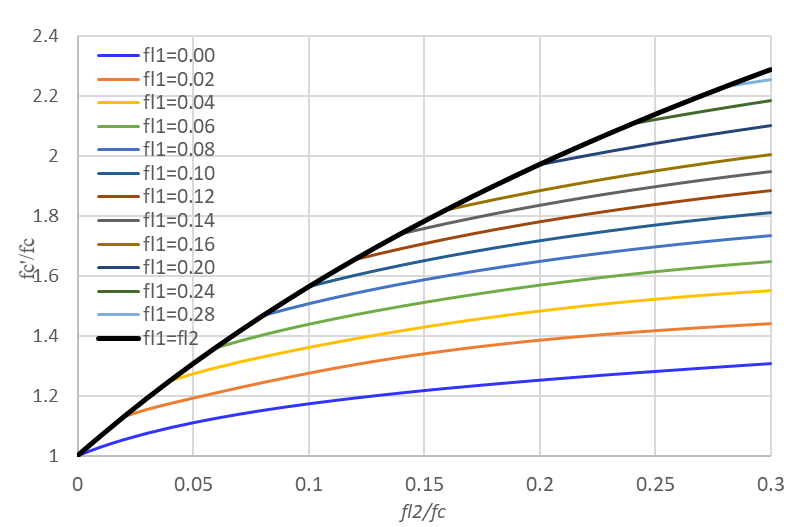
矩形截面的有效约束系数可以通过以下经验公式求得,而不需要查表。


最终可以得到以下公式:

其中, .
.
用上面公式可以画出Mander论文中所用的图表如下。
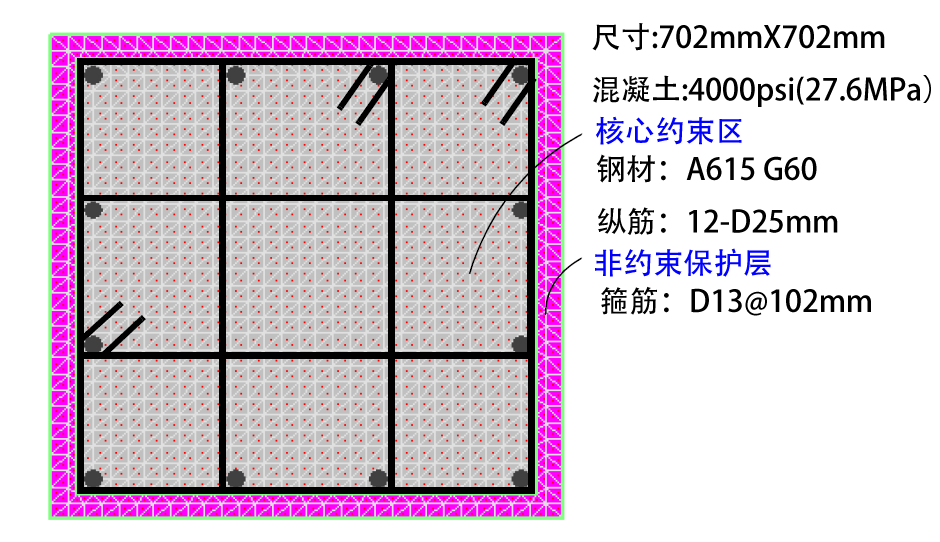
3 在XTRACT中的应用
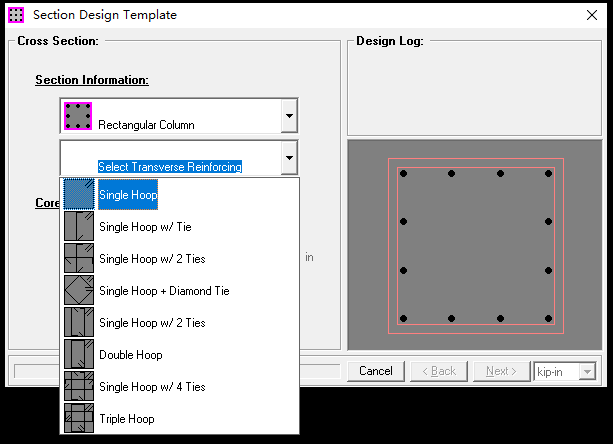
升级打怪离不开各种装备,复杂结构分析离不开各种实用小工具,XTRACT绝对算是截面验算中的权威与佼佼者。回到
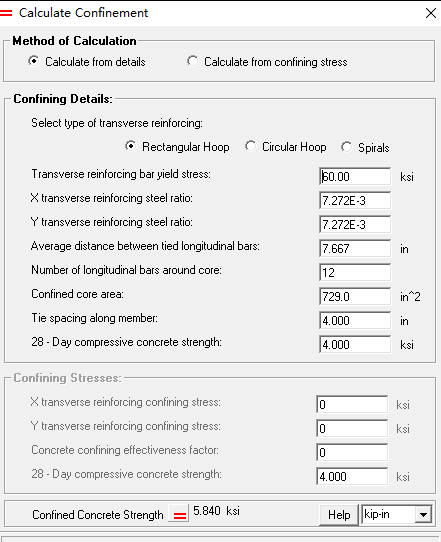
通过计算得到约束混凝土强度提高了1.46倍,更重要的是延性也有较大提高。
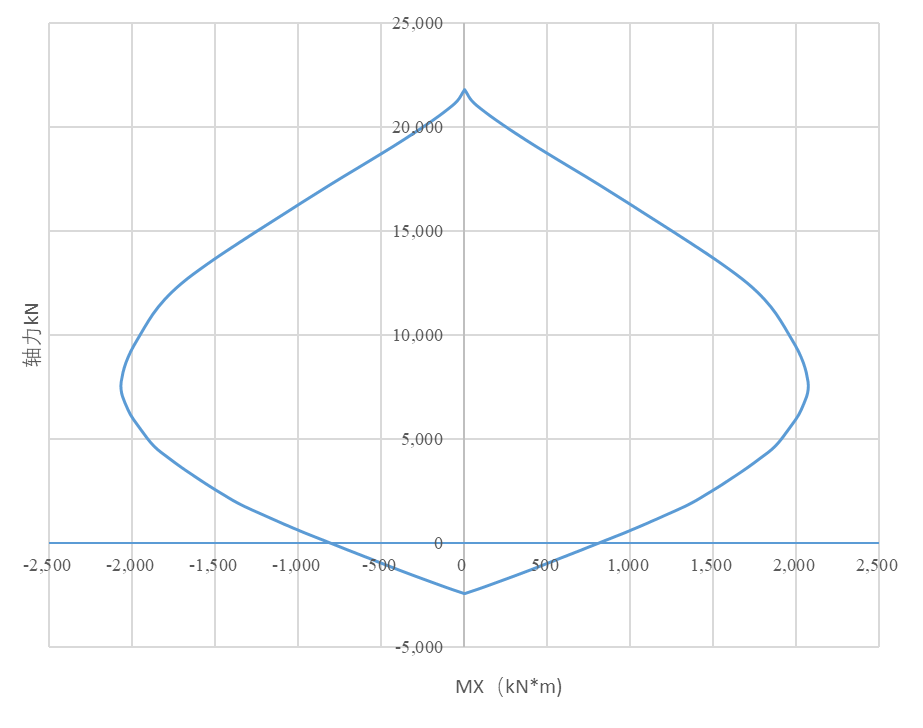
最后根据以上的截面可以求得柱PM曲线如下。
4 结语
有兴趣的朋友可以用XTRACT再验算下开始试验的结果,试试XTRACT不同箍筋约束形式对约束混凝土强度的影响。
1 An Experiment
In 1985, Moehle and Cavanagh conducted a comparative test between plain concrete columns and reinforced concrete columns with different stirrup configurations. All test columns were square (305 mm × 305 mm) with a length of 914 mm, using the same batch of concrete and steel materials. The test results are shown in the figures below.
From the figure above, it is evident that the plain concrete specimen reached its peak strength when the longitudinal compressive strain reached 0.003, followed by rapid strength degradation and eventual diagonal shear failure—a brittle failure mode. In contrast, the desired ductile failure mode involves stirrup yielding at a longitudinal strain of 0.003, spalling of the concrete cover at 0.004, and gradual strength degradation. As longitudinal strain increased, columns A and B exhibited post-degradation strengthening before slow degradation, while column C degraded linearly. Column B failed when transverse stirrups yielded, longitudinal bars buckled, and corner hooks were straightened.
Compared to plain concrete columns, stirrups provide significant confinement to the core concrete, enhancing its deformation capacity. Columns with only outer stirrups (e.g., column C) show improved ductility but not as effectively as configurations with cross or overlapping stirrups, which further enhance confined concrete strength.
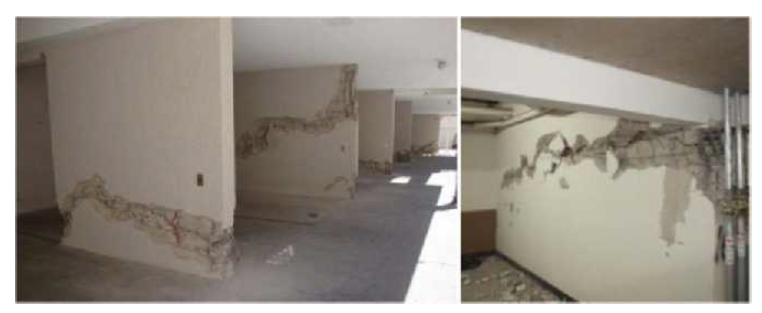
In addition to concrete columns, shear wall boundary elements or end columns also use closed stirrups. Composite structures and concrete-filled steel tubes similarly exhibit confinement effects. However, this discussion focuses on conventional reinforced concrete members. The importance of shear wall boundary elements became evident during the 2010 Chile earthquake. Chilean seismic design methods, similar to ours, use response spectrum analysis. After the 1985 M7.8 earthquake, Chile revised its seismic code (ACI318-95), but an exception removed requirements for confined boundary elements and stirrup加密 for buckling prevention.
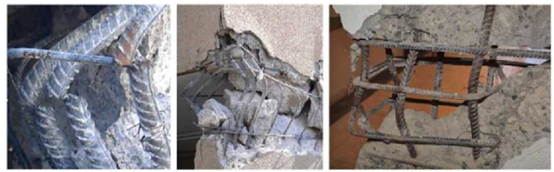
During the 2010 Chile earthquake, concrete shear walls (wall ratio ~3%) suffered severe damage at ground levels or near the base, including concrete crushing, spalling, and longitudinal bar buckling. Such damage, spanning the entire wall or concentrated over 1–3 times the wall thickness, was caused by vertical bar buckling.
Investigations revealed that stirrup spacing in wall boundary elements was excessive (200 mm for both stirrups and horizontal reinforcement). For thin walls (150–200 mm thick) with 20 mm concrete cover, spalling reduced effective thickness by 10–27%. Once the cover spalled, straight-hook stirrups lost confinement, leading to longitudinal bar buckling.
Some failures were due to high axial compression causing global wall buckling (Figure 5), which cannot be resolved by adding stirrups—thicker walls are required.
The importance of stirrup confinement highlights the need to model confined concrete behavior accurately in nonlinear analysis. The Mander model is the most widely used for this purpose.
2 Mander Constitutive Model
The popularity of the Mander model likely stems from its extensive citation in literature and its default adoption in section analysis software like XTRACT. A colleague from the Philippines noted his preference for Mander’s model in nonlinear analysis. Mander’s seminal paper introduced the constitutive curve (Figure 6):
![\[f_{c}=\frac{f_{c c}^{\prime} x r}{r-1+x^{r}} \quad (1)\]](http://www.structurevspoem.com/wp-content/ql-cache/quicklatex.com-fb501dc8dc7f4b6f6b51b2ebc9ebea9c_l3.png "Rendered by QuickLaTeX.com")
where is the confined concrete peak strength, critical to the model:
![\[f_{c c}^{\prime}=f_{c o}^{\prime}+k_{1}f_{l} \quad (2)\]](http://www.structurevspoem.com/wp-content/ql-cache/quicklatex.com-2c56af718f0cae7024d31a6cc0e4f416_l3.png "Rendered by QuickLaTeX.com")
![\[x=\frac{\varepsilon_{c c}}{\varepsilon_c} \quad (3)\]](http://www.structurevspoem.com/wp-content/ql-cache/quicklatex.com-20668b7a529bc205b64bc007fe8afac9_l3.png "Rendered by QuickLaTeX.com")
Here, is the strain at peak strength:
![\[\varepsilon_{c c}=\varepsilon_{c o}\left[1+5\left(\frac{f_{c c}^{\prime}}{f_{c o}^{\prime}}-1\right)\right] \quad (4)\]](http://www.structurevspoem.com/wp-content/ql-cache/quicklatex.com-d31a7d17a6636317b13ded12b70ba06a_l3.png "Rendered by QuickLaTeX.com")
and are the unconfined concrete peak strength and corresponding strain (typically 0.002).
![\[r=\frac{E_{c}}{E_{c}-E_{\mathrm{sec}}} \quad (5)\]](http://www.structurevspoem.com/wp-content/ql-cache/quicklatex.com-dc1864877b34a186894d18b2b39b954d_l3.png "Rendered by QuickLaTeX.com")
where  , and
, and
![\[E_{\mathrm{sec}}=\frac{f_{c c}^{\prime}}{\varepsilon_{c c}} \quad (6)\]](http://www.structurevspoem.com/wp-content/ql-cache/quicklatex.com-bc0237ef7180f04cfae367189e6d4c4b_l3.png "Rendered by QuickLaTeX.com")
The Mander model introduces effective confining stress and effective confinement coefficient concepts. Strength refers to US-standard cylinder strength. For rectangular sections, the confinement coefficient requires lookup tables.
G.A. Chang improved the Mander model by deriving formulas for the effective confinement coefficient . Stirrups do not uniformly confine concrete; arching effects create higher stress in the core center than the periphery.
For circular sections:
![\[f_{l}=\frac{1}{2}k_{e}\rho_{s}{f_{s}}, \quad k_{e}=\frac{A_{e}}{A_{c c}}\]](http://www.structurevspoem.com/wp-content/ql-cache/quicklatex.com-abce630ba87f6736504c9bc914feddc8_l3.png "Rendered by QuickLaTeX.com")
![\[A_{e}=\frac{\pi d_{s}^{2}}{4}\left(1-0.5 \frac{s^{\prime}}{d_{s}}\right)^{k}\]](http://www.structurevspoem.com/wp-content/ql-cache/quicklatex.com-b6e17df4bbf09ddcdbdbcc5182acf7db_l3.png "Rendered by QuickLaTeX.com")
Core area , where:
![\[f_{l}=\frac{\rho_{s} f_{s}}{2} \frac{\left(1-0.5 \frac{s^{\prime}}{d_{s}}\right)^{k}}{1-\rho_{c c}}\]](http://www.structurevspoem.com/wp-content/ql-cache/quicklatex.com-5de5a6e68fae8d916cb783602b79bd09_l3.png "Rendered by QuickLaTeX.com")
Volume stirrup ratio , longitudinal ratio .
For rectangular sections, the confinement coefficient  uses empirical formulas without lookup tables:
![\[K=\frac{f_{c c}^{\prime}}{f_{c}^{\prime}}=1+A \bar{x}\left(0.1+\frac{0.9}{1+B \bar{x}}\right), \quad \bar{x}=\frac{f_{l 1}^{\prime}+f_{l 2}^{\prime}}{2 f_{c}^{\prime}}\]](http://www.structurevspoem.com/wp-content/ql-cache/quicklatex.com-15b5c2422c07cc008d9d1770888c17b7_l3.png "Rendered by QuickLaTeX.com")
![\[r=\frac{f_{l 1}^{\prime}}{f_{l 2}^{\prime}} \quad (f_{l 2}^{\prime} \geq f_{l 1}^{\prime})\]](http://www.structurevspoem.com/wp-content/ql-cache/quicklatex.com-592d785d94e0fd07f278b84e3e87cadc_l3.png "Rendered by QuickLaTeX.com")
![\[A=6.8886-(0.6069+17.275 r) e^{-4.989 r}, \quad B=\frac{4.5}{\frac{5}{A}\left(0.9849-0.6306 e^{-3.8939 r}\right)-0.1}-5\]](http://www.structurevspoem.com/wp-content/ql-cache/quicklatex.com-f857ce299d44d204c2fb42a4d139646d_l3.png "Rendered by QuickLaTeX.com")
Final equation:
![\[K=\frac{f_{c c}^{\prime}}{f_{c o}^{\prime}}=1+k_{1} \bar{x} \quad \text{where } k_{1}=A\left(0.1+\frac{0.9}{1+B \bar{x}}\right)\]](http://www.structurevspoem.com/wp-content/ql-cache/quicklatex.com-a6d888feb892ae7bb5e7e18ddc32a1f5_l3.png "Rendered by QuickLaTeX.com")
3 Application in XTRACT
XTRACT is a leading tool for section analysis. As shown in the example below:
XTRACT calculated a 1.46x increase in confined concrete strength and significantly improved ductility:
The resulting PM interaction curve is shown below:
4 Conclusion
Readers are encouraged to re-analyze the initial experiment using XTRACT to compare the effects of different stirrup configurations on confined concrete strength:
往期文章
#参数化建模#
#结构编程#
#建筑大师#
#结构大师#
#高层建筑设计-以结构为建筑[上] bySOM大神马克*夏凯星
#高层建筑设计-以结构为建筑[中] bySOM大神马克*夏凯星
#高层建筑设计-以结构为建筑[下] bySOM大神马克*夏凯星
#抗震性能设计大神Graham.H.Powell讲座第1节-上
#抗震性能设计大神Graham.H.Powell讲座第1节-下
#超高层建筑抗震性能设计by伯克利教授Jack Moehle
#结构设计#